 Research LabPick a market situation and see how every detector reacts.
Analytics
Explore what the detectors actually found.
Offline simulation · Preliminary research results. Alerts indicate unusual activity, not proof of manipulation.
Detection and false accusations
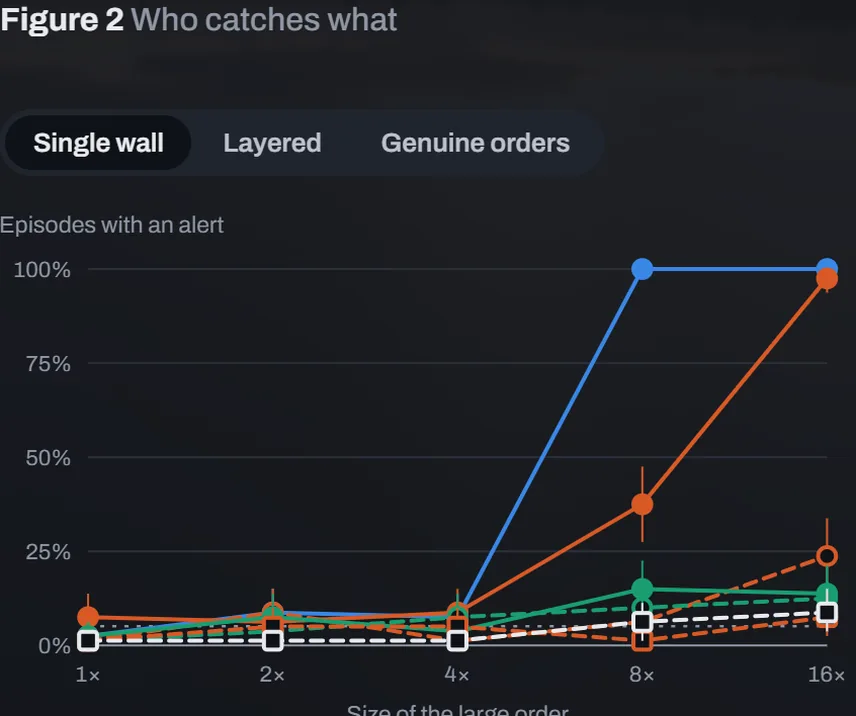
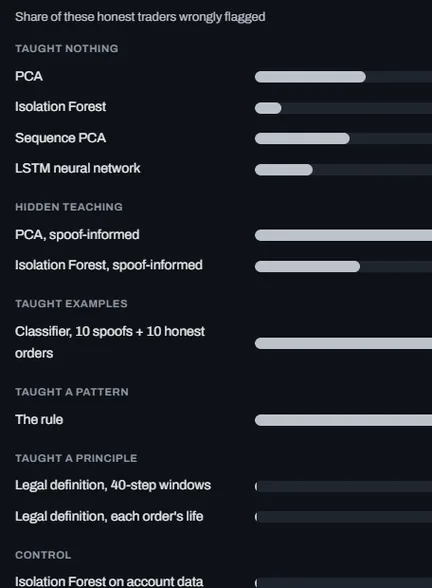
Share of spoof episodes caught versus matched honest orders flagged. Both use the same alert window.
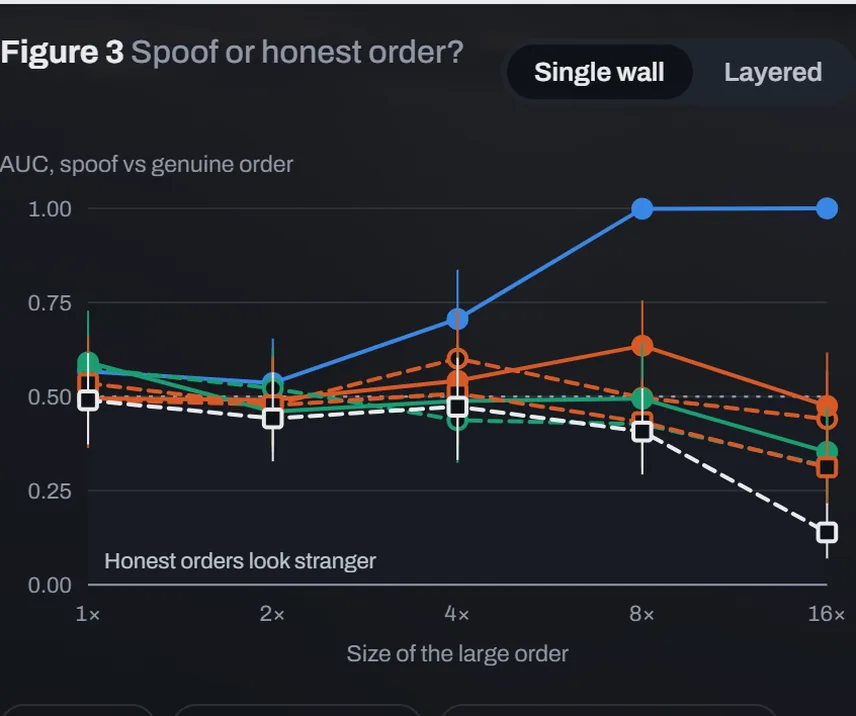
Can it tell them apart?
AUC compares spoof scores with same-size honest orders. Above 0.5 favours spoofs; below 0.5 means honest orders look stranger.
Normal markets, false alarms
Share of ordinary bars flagged, with no spoofing. This chart follows the training filter; spoof pattern and size do not apply.
Does the wall help the spoofer?
Extra chance the genuine order fills, compared with its honest twin in the calm market. Follows pattern and size; independent of detector training.
Source: impact.csv. Paired sessions share a random seed; the wall is the intervention.
Compare the exact values
Same filters as the charts. Detection uses an eight-bar episode window. Normal-market false alarms use individual bars. Confidence intervals are 95% bootstrap intervals.
Sources: metrics.csv and auc.csv, exported by build_site.py. Display values are rounded; the CSV download retains the precision of the website export.
Robustness checks
These follow-up experiments have their own fixed settings and do not change with the filters above.
Do the claims survive different markets?
Sources: sensitivity.csv and the main experiment. “Holds” means the stated check passes in that simulated market; it is not a claim of real-world validity.
Individual orders: size, lifetime, fill rate and position
Source: orders.csv. The order-level threshold is calibrated to flag 0.1% of ordinary validation orders. Its population and threshold differ from the bar-level comparison above.
Finer time resolution
Source: resolution.csv. Features computed every step; sequence models read 24-step windows. Results below use 16× orders.